
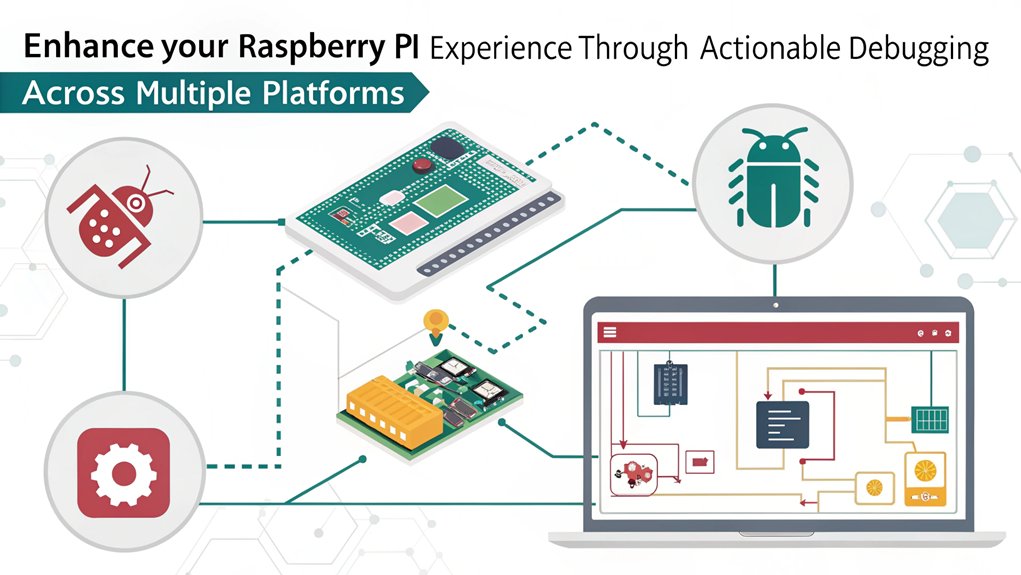
Using effective debugging tools for Raspberry Pi is essential for optimizing performance and ensuring code robustness. These tools enable you to perform step-through execution, allowing meticulous line-by-line analysis of your programs. Features like breakpoints, assertions, and monitoring for system metrics help preemptively address issues and enhance troubleshooting efficiency. With cost-effective solutions and user-friendly setup, you can seamlessly integrate these tools into various development environments. Furthermore, advanced capabilities like USB-to-UART connectivity and boot diagnostics streamline your debugging process. Discovering how to leverage these tools effectively can greatly enhance your Raspberry Pi projects and overall productivity.
Key Takeaways
- Effective debugging tools expedite issue resolution, improving overall performance, and reducing downtime when working with Raspberry Pi projects.
- Features like step-through execution and breakpoints allow for detailed, line-by-line analysis of code, enhancing bug detection and code reliability.
- Diagnostic capabilities enable troubleshooting of both system boot processes and network connectivity issues, ensuring optimal performance during development.
- Cost-efficient and user-friendly, these tools facilitate quick setup and are compatible with various platforms, allowing diverse development environments.
- Advanced monitoring functionalities provide insights into hardware integrity, CPU frequency, and SoC temperature, ensuring stable and reliable application performance.
Benefits of Effective Debugging Tools For Raspberry Pi
Effective debugging tools offer significant advantages that streamline the development process for Raspberry Pi users. Emphasizing performance improvements, these tools enhance your capability to pinpoint and resolve issues with minimal delay. For instance, features like step-through execution allow you to analyze your program line by line, guaranteeing you understand its state thoroughly at each execution point.
You also gain workflow enhancements with the inclusion of breakpoints and assertions, helping you check input parameters efficiently. The ability to visualize registers and instructions simplifies complex debugging tasks, while core dumps provide a quick reference for problem identification. Replay and analysis functionalities track elusive bugs that depend on event-order, saving you considerable time. Furthermore, the Raspberry Pi Debug Probe is designed for high-speed debugging capabilities, enabling you to address issues even more swiftly.
Moreover, the Raspberry Pi Debug Probe boasts faster debugging speeds when compared to its predecessors, encouraging a more efficient use of your time and resources. Its plug-and-play setup means you’re ready to work without cumbersome installations or setups, making it a highly accessible tool. Additionally, employing techniques like assert macros can significantly enhance code robustness and facilitate bug detection. This is particularly crucial when working with demanding applications such as GPU-intensive emulations.
The integration with existing workflows further guarantees you can focus on innovation rather than troubleshooting, solidifying your productivity. Overall, effective debugging tools fundamentally optimize your development experience with Raspberry Pi.
Compatibility With Various Platforms
The diverse compatibility of debugging tools greatly enhances the Raspberry Pi development experience. With robust cross-platform support, you can seamlessly integrate these tools into your existing workflows, whether you’re using Windows, Mac, or typical Linux systems. This versatility assures that you can debug and program Raspberry Pi Pico hardware without relying on a GPIO header, streamlining your process.
Moreover, many debugging tools are designed to work effectively with various Arm-based microcontrollers. They support standard interfaces such as UART and CMSIS-DAP, making it possible to interact with a wide array of devices. This allows you to undertake versatile debugging across multiple platforms efficiently. Furthermore, tools like the Raspberry Pi Debug Probe are designed for solderless operation, making them even more user-friendly.
Additionally, these tools integrate effortlessly with popular debugging software like OpenOCD and GDB, reinforcing their applicability across different setups. Notably, effective debugging tools empower you to maintain a smooth flow from development to deployment, ensuring efficient problem-solving. For remote access and management, utilizing SSH connections is highly beneficial for controlling and debugging your Raspberry Pi remotely.
Thanks to their design, you can utilize USB-to-debug and USB-to-UART bridges, which means easy connections to host computers without complicated setups. Consequently, their compatibility not only expands your development capabilities but also facilitates a more innovative approach to solving problems on the Raspberry Pi platform and beyond.
User-Friendly Setup and Usage
How easy is it to set up and use the Raspberry Pi Debug Probe? With a simplified connection process and user-friendly interface, it takes only minutes to get started. The included kit comes with all necessary jumper and GND wires, ensuring you can form straightforward connections. You’ll attach the probe to the Raspberry Pi Pico or Pico W, linking specific pins like SW_CLK, GND, and the included USB cable to your computer. This dedicated device allows for deep exploration into projects, further enhancing the debugging experience. For instance, ensuring stable network connections as described in network settings is crucial for seamless debugging. The debug probe effectively facilitates a clearer understanding of hardware interactions, which is crucial for successful programming.
For optimal performance, ensure you have a stable power supply, such as a 5V power supply with specific current needs power requirements.
The intuitive design of the debug probe allows you to navigate its features seamlessly, even as a novice developer. Visual indicators, such as a red LED, make it easy to monitor power status.
Here’s a quick comparison of its features:
| Features | Benefits |
|---|---|
| Simplified Connection Process | Reduces setup complexity |
| User-Friendly Interface | Easy navigation for effective debugging |
| Visual Indicators | Provides instant feedback on system status |
| Hardware-Level Logs | Deep insights into operations and issues |
Cost Efficiency of Debugging Solutions

While considering various debugging solutions, the cost efficiency of the Raspberry Pi Debug Probe stands out. Priced at just $12, it leverages the Raspberry Pi Pico hardware, allowing you to keep costs low without sacrificing functionality.
Minimal additional expenses are required since necessary cables and USB connections are included, and its compatibility with Windows, Mac, and Linux eliminates extra costs across platforms. Additionally, the probe is designed with extensive support for built-in debugging, enhancing overall usability for developers. Its design utilizes a 3-pin debug connector, making it easy to connect with various platforms.
This tool’s versatile usage enhances its value, supporting any Arm-based microcontroller with a standard SWD port. You can employ it across various debugging strategies, combining both SWD and UART functionalities in one device. By using a single probe, you reduce long-term costs associated with maintaining multiple tools.
The open-source firmware guarantees tool longevity, delivering free updates and customizations. With its robust design, it minimizes wear and tear, cutting down on frequent cable replacements.
Additionally, the Raspberry Pi Debug Probe can even serve as a USB-to-UART cable, broadening its utility. Compared to alternatives, this debug solution offers significant long-term savings and streamlined productivity, making it an ideal choice for innovative developers.
Advanced Diagnostic Capabilities
When managing Raspberry Pi projects, having advanced diagnostic capabilities is vital for maintaining system integrity and performance. Utilizing sophisticated diagnostic utilities enables you to monitor key system metrics, like CPU frequency, GPU RAM, and SoC temperature. These insights can help preemptively address throttling and under-voltage scenarios, thereby ensuring a stable environment for your applications. Moreover, PiDoctor is an excellent example of a tool that provides such capabilities. Boot diagnostics can also aid in troubleshooting startup issues, giving you greater control over your boot process.
Furthermore, the ability to explore filesystem details and device hierarchies offers you a thorough view of your Raspberry Pi’s operational landscape. By employing error tracking alongside tools like GDB for interactive debugging, you can efficiently isolate and analyze faults in your code.
Network diagnostics play an important role as well, allowing you to scan WiFi networks, assess connectivity strength, and verify network boot parameters. With this knowledge, you can refine your projects to work seamlessly in diverse environments.
Lastly, monitoring USB devices and GPIO integrity helps safeguard your hardware’s physical health. By harnessing these advanced capabilities, you transform your Raspberry Pi into a robust and responsive development machine, empowering you to innovate without limitations.
Frequently Asked Questions
How Do Debugging Tools Affect Overall Software Development Timelines?
Debugging tools greatly enhance development efficiency by streamlining your debugging methodology. They accelerate bug identification, reduce troubleshooting time, and minimize disruptions, ultimately leading to faster project completion and higher software quality.
Can I Use the Raspberry Pi Debug Probe With Non-Arm Devices?
You can’t effectively use the Raspberry Pi Debug Probe with non-Arm devices due to its limited cross-platform compatibility and specific probe functionality tailored exclusively for Arm architectures, resulting in impractical integration efforts with other systems.
What Are Common Mistakes to Avoid When Debugging With These Tools?
You might think debugging is straightforward, but common errors can trip you up. Avoid mismatched settings, insufficient dependencies, and incompatible software versions to enhance your debugging strategies and guarantee smoother, more effective troubleshooting sessions.
How Often Should I Update My Debugging Tools’ Firmware?
You should check for firmware updates regularly, as there’s no fixed frequency. Keeping your debugging tools’ firmware updated enhances compatibility, guarantees security, and improves efficiency, so stay attentive to changes in the official repositories.
Is Technical Support Available for Open-Source Debugging Solutions?
Yes, open-source solutions benefit from robust community support. You’ll find documentation, forums for troubleshooting, and collaborative projects like picoLink and Picoprobe. Engaging with this community enhances your experience and fosters innovation in debugging techniques
Conclusion
In today’s fast-paced development environment, harnessing effective debugging tools for your Raspberry Pi is essential. They not only enhance your troubleshooting efficiency but also bridge compatibility gaps across various platforms. By opting for user-friendly setups, you’re saving valuable time and resources while gaining advanced diagnostic capabilities. Ultimately, choosing the right debugging solutions is like hitting the nail on the head—ensuring smooth, successful project execution and paving the way for innovation in your Raspberry Pi endeavors.

I am a retired software engineer with experience in a multitude of areas including managing AWS and VMWare development environments. I bought a relative a mini-PC a year ago and have become passionate about the technology and its potential to change how we deploy software.